Imax Corporation Reports Q4 And Full-Year 2023 Results
- Global entertainment technology platform delivers over 25% YoY growth in FY23 across Revenue, Net Income, Adjusted EBITDA(1)and Adjusted EPS(1)(2)
- Full-Year GAAP EPS of
$0.46 , up from a loss of ($0.40 ) in FY22; Full-Year Adjusted EPS of$0.94 , up from$0.06 in FY22 - Net Income of
$25 million in FY23 increased from a loss of$(23) million in 2022 while Adjusted EBITDA(2)increases to$128 million in FY23, up 52% from$84 million in FY22 - System sales activity increases 174% YoY to 129 signings worldwide in FY23
- Company delivers on high end of guidance with 128 system installations in FY23, up from 92 in FY22
- IMAX achieves global box office of approximately
$1.1 billion , approaching previous record - Full-Year cash from operations more than triples to
$59 million in FY23, up from$17 million FY22
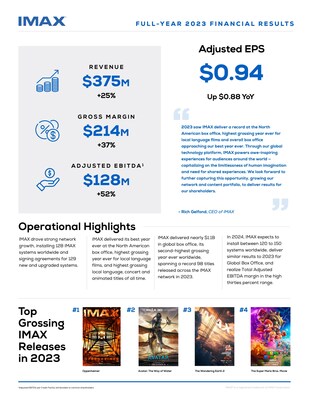
"IMAX delivered excellent results in 2023 — we grew Net Income by
"As the entertainment landscape transforms, it is clear that IMAX is among its premier, in-demand destinations. We drove significant expansion and diversification of our global footprint, with a record 61 of our system installations coming from strategic Rest of World markets such as
"Our strong network growth is a direct result of our global content strategy, which has yielded the biggest and most diverse portfolio of IMAX Experiences ever. 2023 saw IMAX deliver a record at the North American box office, highest grossing year ever for local language films and overall box office approaching our best year ever. We are strategically managing our content portfolio to drive greater share of
"Through our global technology platform, IMAX powers awe-inspiring experiences for audiences around the world — capitalizing on the limitlessness of human imagination and need for shared experiences. We look forward to further capturing this opportunity, growing our network and content portfolio, to deliver results for our shareholders."
_______________ | |
(1) | Non-GAAP Financial Measure. See the discussion at the end of this earnings release for a description of the non-GAAP financial measures used herein, as well as reconciliations to the most comparable GAAP amounts. |
(2) | Attributable to common shareholders. |
Fourth Quarter and December Full-Year Financial Highlights | ||||||||||||||||||||||
Three Months Ended | Year Ended | |||||||||||||||||||||
In millions of | 2023 | 2022 | YoY % | 2023 | 2022 | YoY % | ||||||||||||||||
Total Revenue | $ | 86.0 | $ | 98.0 | (12 %) | $ | 374.8 | $ | 300.8 | 25 % | ||||||||||||
Gross Margin | $ | 43.7 | $ | 48.8 | (11 %) | $ | 214.3 | $ | 156.4 | 37 % | ||||||||||||
Gross Margin (%) | 51 | % | 50 | % | 57 | % | 52 | % | ||||||||||||||
Adjusted EBITDA - attributable to common shareholders(1)(3) | $ | 23.0 | $ | 27.8 | (17 %) | $ | 128.2 | $ | 84.5 | 52 % | ||||||||||||
Adjusted EBITDA Margin (%) - attributable to common shareholders(1)(3) | 28 | % | 31 | % | (8 %) | 37 | % | 30 | % | 22 % | ||||||||||||
Total Adjusted EBITDA(1)(3)(4) | $ | 25.2 | $ | 31.5 | (20 %) | $ | 144.0 | $ | 95.7 | 51 % | ||||||||||||
Total Adjusted EBITDA Margin (%)(1)(3)(4) | 29 | % | 32 | % | (9 %) | 38 | % | 32 | % | 21 % | ||||||||||||
Net Income (Loss)(2) | $ | 2.5 | $ | 2.6 | (3 %) | $ | 25.3 | $ | (22.8) | N/A | ||||||||||||
Net Income (Loss) per share(2)- basic and diluted | $ | 0.05 | $ | 0.05 | — | $ | 0.46 | $ | (0.40) | N/A | ||||||||||||
Adjusted Net Income(1)(2) | $ | 9.3 | $ | 10.6 | (12 %) | $ | 52.1 | $ | 3.2 | N/A | ||||||||||||
Adjusted Earnings Per Share(1)(2) | $ | 0.17 | $ | 0.19 | (11 %) | $ | 0.94 | $ | 0.06 | N/A | ||||||||||||
Weighted average shares outstanding (in millions)(5): | ||||||||||||||||||||||
Basic | 54.0 | 54.8 | (2 %) | 54.3 | 56.7 | (4 %) | ||||||||||||||||
Diluted | 55.0 | 55.7 | (1 %) | 55.1 | 57.4 | (4 %) | ||||||||||||||||
_______________ | |
(1) | Non-GAAP Financial Measure. See the discussion at the end of this earnings release for a description of the non-GAAP financial measures used herein, as well as reconciliations to the most comparable GAAP amounts. |
(2) | Attributable to common shareholders. |
(3) | Per Credit Facility. |
(4) | Total Adjusted EBITDA is equivalent to Total Adjusted EBITDA Attributable to Non-controlling Interests and Common Shareholders. |
(5) | Reflects weighted average shares outstanding used in Adjusted Earnings Per Share calculation. |
Fourth Quarter and Full Year Segment Results(1) | |||||||||||||||||||||||||
Content Solutions | Technology Products and Services | ||||||||||||||||||||||||
Revenue | Gross Margin | Gross | Revenue | Gross Margin | Gross | ||||||||||||||||||||
4Q23 | $ | 19.1 | $ | 9.7 | 51 | % | $ | 62.5 | $ | 29.9 | 48 | % | |||||||||||||
4Q22 | 29.3 | 12.1 | 41 | % | 66.1 | 35.2 | 53 | % | |||||||||||||||||
% change | (35) | % | (20) | % | (5) | % | (15) | % | |||||||||||||||||
FY23 | $ | 126.7 | $ | 74.1 | 58 | % | $ | 234.3 | $ | 129.9 | 55 | % | |||||||||||||
FY22 | 101.8 | 51.2 | 50 | % | 192.4 | 101.1 | 53 | % | |||||||||||||||||
% change | 24 | % | 45 | % | 22 | % | 28 | % | |||||||||||||||||
_______________ | |
(1) | Please refer to the Company's Form 10-K for the year ended |
Content Solutions Segment
- Content Solutions revenue of
$126.7 million increased 24% year-over-year for the full year 2023 while Q4 revenue of$19.1 million decreased 35% year-over-year. Gross box office from IMAX locations for full year 2023 of approximately$1.1 billion was up 25% while Q4 2023 of$170 million was down 32% year-over-year. IMAX set numerous records for box office during 2023 including:- Highest full year local language box office of
$227 million - Highest full year domestic box office of
$393 million - Highest Q3 box office of
$347 million
- Highest full year local language box office of
- Gross margin for Content Solutions of
$74.1 million for the full year 2023 increased 45% year-over-year while Q4 gross margin of$9.7 million decreased 20% year-over-year. The Company saw significant margin expansion for the full year 2023 (up 800 basis points) and Q4 2023 (up 1000 basis points) driven by the operating leverage in our business along with our disciplined cost management.
Technology Products and Services Segment
- Technology Products and Services revenues and gross margin for full year 2023 increased 22% year-over-year to
$234.3 million and 28% year-over-year to$129.9 million , respectively. Q4 revenue and gross margin decreased 5% year-over-year to$62.5 million and 15% year-over-year to$29.9 million , respectively. - For the full year 2023 the Company installed 128 systems compared to 92 systems in full year 2022. Of those, 75 systems were under sales and hybrid JRSA arrangements, compared to 46 systems in the prior year.
- During the fourth quarter the Company installed 69 systems compared to 52 systems in the fourth quarter of 2022. Of those, 38 systems were under sales and hybrid JRSA arrangements, compared to 24 systems in the prior year.
- Commercial network growth accelerated with the number of IMAX locations increasing 4% year-over-year to 1,693. The Company ended 2023 with a backlog of 450 IMAX systems.
Operating Cash Flow and Liquidity
Net cash provided by operating activities for full year 2023 was
As of
In 2021, the Company issued
Share Count and Capital Return
The weighted average basic and diluted shares outstanding used in the calculation of adjusted EPS for the full year of 2023 were 54.3 million and 55.1 million, respectively, compared to 56.7 million and 57.4 million, respectively for the full year 2022, a decrease year-over-year of 4% for both basic and diluted shares outstanding.
For the full year 2023, the Company repurchased 1.6 million common shares at an average price of
On
2024 Guidance
The Company expects the following for the full year 2024:
- IMAX Gross Box Office: Similar to 2023
- System Installations: 120 to 150 Systems
- Total Consolidated Adjusted EBITDA Margin: High 30's percent
Supplemental Materials
For more information about the Company's results, please refer to the IMAX Investor Relations website located at investors.imax.com.
Investor Relations Website and Social Media
On a monthly basis, the Company posts quarter-to-date box office results on the IMAX Investor Relations website located at investors.imax.com. The Company expects to provide such updates within five business days of month-end, although the Company may change this timing without notice.
The Company may post additional information on the Company's corporate and Investor Relations website which may be material to investors. Accordingly, investors, media and others interested in the Company should monitor the Company's website in addition to the Company's press releases,
Conference Call
The Company will host a conference call today at
About
IMAX, an innovator in entertainment technology, combines proprietary software, architecture, and equipment to create experiences that take you beyond the edge of your seat to a world you've never imagined. Top filmmakers and studios are utilizing IMAX systems to connect with audiences in extraordinary ways, making IMAX's network among the most important and successful theatrical distribution platforms for major event films around the globe.
IMAX is headquartered in
IMAX®, IMAX®3D, Experience It In IMAX®, The IMAX Experience®, DMR®, Filmed For IMAX®, IMAX LIVETM, IMAX Enhanced® are trademarks and trade names of
For additional information please contact:
Investors: 212-821-0154 | Media:
|
Forward-Looking Statements
This earnings release contains forward looking statements that are based on IMAX management's assumptions and existing information and involve certain risks and uncertainties which could cause actual results to differ materially from future results expressed or implied by such forward looking statements. These forward-looking statements include, but are not limited to, business and technology strategies and measures to implement strategies, competitive strengths, goals, expansion and growth of business, operations and technology, future capital expenditures (including the amount and nature thereof), industry prospects and consumer behavior, plans and references to the future success of
Primary Reporting Groups
The Company's Chief Executive Officer ("CEO") is its Chief Operating Decision Maker ("CODM"), as such term is defined under
In the first quarter of 2023, the Company revised its internal segment reporting, including the information provided to the CODM to assess segment performance and allocate resources.
The Company has the following reportable segments:
(i) | Content Solutions, which principally includes the digital remastering of films and other content into IMAX formats for distribution to the IMAX network. To a lesser extent, the Content Solutions segment also earns revenue from the distribution of large-format documentary films and exclusive experiences ranging from live performances to interactive events with leading artists and creators, as well as film post-production services. |
(ii) | Technology Products and Services, which includes results from the sale or lease of IMAX Systems, as well as from the maintenance of IMAX Systems. To a lesser extent, the Technology Product and Services segment also earns revenue from certain ancillary theater business activities, including after-market sales of IMAX System parts and 3D glasses. |
Transactions between segments are valued at exchange value. Inter-segment profits are eliminated upon consolidation, as well as for the disclosures below.
IMAX Network and Backlog | ||||||||||||||||
Three Months | Year | |||||||||||||||
System Signings(1): | 2023 | 2022 | 2023 | 2022 | ||||||||||||
Sales Arrangements | 10 | 11 | 64 | 21 | ||||||||||||
Hybrid JRSA | — | — | — | 3 | ||||||||||||
Traditional JRSA | 25 | 1 | 65 | 23 | ||||||||||||
Total IMAX System signings | 35 | 12 | 129 | 47 | ||||||||||||
Three Months | Year | |||||||||||||||
System Installations(2): | 2023 | 2022 | 2023 | 2022 | ||||||||||||
Sales Arrangements | 35 | 21 | 70 | 38 | ||||||||||||
Hybrid JRSA | 3 | 3 | 5 | 8 | ||||||||||||
Traditional JRSA | 31 | 28 | 53 | 46 | ||||||||||||
Total IMAX System installations | 69 | 52 | 128 | 92 | ||||||||||||
Year | ||||||||||
System Backlog: | 2023 | 2022 | ||||||||
Sales Arrangements | 164 | 162 | ||||||||
Hybrid JRSA | 103 | 120 | ||||||||
Traditional JRSA | 183 | 168 | ||||||||
Total System backlog | 450 | 450 | ||||||||
Year | ||||||||||
System Network: | 2023 | 2022 | ||||||||
Commercial Multiplex Systems | ||||||||||
Sales Arrangements | 769 | 702 | ||||||||
Hybrid JRSA | 138 | 151 | ||||||||
Traditional JRSA | 786 | 780 | ||||||||
Total Commercial Multiplex Systems | 1,693 | 1,633 | ||||||||
Commercial Destination Systems | 12 | 12 | ||||||||
Institutional Systems | 67 | 71 | ||||||||
Total System network | 1,772 | 1,716 | ||||||||
______________ | |
(1) | System signings include new signings of 32 in Q4 2023, 9 in Q4 2022, 108 in the full year 2023 and 30 in the full year 2022. |
(2) | System installations include new systems installations of 47 in Q4 2023, 21 in Q4 2022, 86 in the full year 2023 and 56 in the full year 2022. |
CONSOLIDATED STATEMENTS OF OPERATIONS (In thousands of | |||||||||||||||||
Three Months Ended | |||||||||||||||||
Year Ended | |||||||||||||||||
(Unaudited) | |||||||||||||||||
2023 | 2022 | 2023 | 2022 | ||||||||||||||
Revenues | |||||||||||||||||
Technology sales | $ | 35,337 | $ | 33,888 | $ | 100,792 | $ | 69,158 | |||||||||
Image enhancement and maintenance services | 35,508 | 44,094 | 189,752 | 161,379 | |||||||||||||
Technology rentals | 12,954 | 18,060 | 75,566 | 61,786 | |||||||||||||
Finance income | 2,219 | 2,004 | 8,729 | 8,482 | |||||||||||||
86,018 | 98,046 | 374,839 | 300,805 | ||||||||||||||
Costs and expenses applicable to revenues | |||||||||||||||||
Technology sales | 17,805 | 17,346 | 46,756 | 37,610 | |||||||||||||
Image enhancement and maintenance services | 18,586 | 25,575 | 88,056 | 81,834 | |||||||||||||
Technology rentals | 5,939 | 6,278 | 25,686 | 25,006 | |||||||||||||
42,330 | 49,199 | 160,498 | 144,450 | ||||||||||||||
Gross margin | 43,688 | 48,847 | 214,341 | 156,355 | |||||||||||||
Selling, general and administrative expenses | 35,070 | 37,862 | 144,406 | 138,043 | |||||||||||||
Research and development | 2,722 | 1,633 | 10,110 | 5,300 | |||||||||||||
Amortization of intangible assets | 1,250 | 1,417 | 4,578 | 4,829 | |||||||||||||
Credit loss expense (reversal), net | 170 | 398 | 1,759 | 8,547 | |||||||||||||
Asset impairments | 144 | — | 144 | 4,470 | |||||||||||||
Restructuring and executive transition costs | 1,593 | — | 2,946 | — | |||||||||||||
Income (loss) from operations | 2,739 | 7,537 | 50,398 | (4,834) | |||||||||||||
Realized and unrealized investment gains (losses) | 29 | (29) | 465 | 70 | |||||||||||||
Retirement benefits non-service expense | (179) | (139) | (411) | (556) | |||||||||||||
Interest income | 648 | 252 | 2,486 | 1,428 | |||||||||||||
Interest expense | (1,776) | (1,523) | (6,821) | (5,877) | |||||||||||||
Income (loss) before taxes | 1,461 | 6,098 | 46,117 | (9,769) | |||||||||||||
Income tax recovery (expense) | 1,850 | (2,017) | (13,051) | (10,108) | |||||||||||||
Net income (loss) | 3,311 | 4,081 | 33,066 | (19,877) | |||||||||||||
Net income attributable to non-controlling interests | (771) | (1,468) | (7,731) | (2,923) | |||||||||||||
Net income (loss) attributable to common shareholders | $ | 2,540 | $ | 2,613 | $ | 25,335 | $ | (22,800) | |||||||||
Net income (loss) per share attributable to common shareholders | |||||||||||||||||
Basic | $ | 0.05 | $ | 0.05 | $ | 0.47 | $ | (0.40) | |||||||||
Diluted | $ | 0.05 | $ | 0.05 | $ | 0.46 | $ | (0.40) | |||||||||
Weighted average shares outstanding (in thousands): | |||||||||||||||||
Basic | 53,973 | 54,816 | 54,310 | 56,674 | |||||||||||||
Diluted | 54,983 | 55,659 | 55,146 | 56,674 | |||||||||||||
Additional Disclosure: | |||||||||||||||||
Depreciation and amortization | $ | 13,545 | $ | 13,998 | $ | 60,022 | $ | 56,661 | |||||||||
Amortization of deferred financing costs | $ | 493 | $ | 712 | $ | 2,235 | $ | 3,177 | |||||||||
CONSOLIDATED BALANCE SHEETS (In thousands of dollars, except share amounts) | ||||||||
As of | ||||||||
2023 | 2022 | |||||||
Assets | ||||||||
Cash and cash equivalents | $ | 76,200 | $ | 97,401 | ||||
Accounts receivable, net of allowance for credit losses | 136,259 | 136,142 | ||||||
Financing receivables, net of allowance for credit losses | 127,154 | 129,384 | ||||||
Variable consideration receivable, net of allowance for credit losses | 64,338 | 44,024 | ||||||
Inventories | 31,584 | 31,534 | ||||||
Prepaid expenses | 12,345 | 12,343 | ||||||
Film assets, net of accumulated amortization | 6,786 | 5,277 | ||||||
Property, plant and equipment, net of accumulated depreciation | 243,299 | 252,896 | ||||||
Investment in equity securities | — | 1,035 | ||||||
Other assets | 20,879 | 15,665 | ||||||
Deferred income tax assets, net of valuation allowance | 7,988 | 9,900 | ||||||
52,815 | 52,815 | |||||||
Other intangible assets, net of accumulated amortization | 35,022 | 32,738 | ||||||
Total assets | $ | 814,669 | $ | 821,154 | ||||
Liabilities | ||||||||
Accounts payable | $ | 26,386 | $ | 25,237 | ||||
Accrued and other liabilities | 111,013 | 117,286 | ||||||
Deferred revenue | 67,105 | 70,940 | ||||||
Revolving credit facility borrowings, net of unamortized debt issuance costs | 22,924 | 36,111 | ||||||
Convertible notes and other borrowings, net of unamortized discounts and debt issuance costs | 229,131 | 226,912 | ||||||
Deferred income tax liabilities | 12,521 | 14,900 | ||||||
Total liabilities | 469,080 | 491,386 | ||||||
Commitments, contingencies and guarantees | ||||||||
Non-controlling interests | 658 | 722 | ||||||
Shareholders' equity | ||||||||
Capital stock common shares — no par value. Authorized — unlimited number. | ||||||||
53,260,276 issued and outstanding ( | 389,048 | 376,715 | ||||||
Other equity | 185,087 | 185,678 | ||||||
Statutory surplus reserve | 3,932 | 3,932 | ||||||
Accumulated deficit | (292,845) | (293,124) | ||||||
Accumulated other comprehensive loss | (12,081) | (9,846) | ||||||
Total shareholders' equity attributable to common shareholders | 273,141 | 263,355 | ||||||
Non-controlling interests | 71,790 | 65,691 | ||||||
Total shareholders' equity | 344,931 | 329,046 | ||||||
Total liabilities and shareholders' equity | $ | 814,669 | $ | 821,154 | ||||
CONSOLIDATED STATEMENTS OF CASH FLOWS (In thousands of dollars) | ||||||||||
Years Ended | ||||||||||
2023 | 2022 | |||||||||
Operating Activities | ||||||||||
Net income (loss) | $ | 33,066 | $ | (19,877) | ||||||
Adjustments to reconcile net income (loss) to cash provided by operating activities: | ||||||||||
Depreciation and amortization | 60,022 | 56,661 | ||||||||
Amortization of deferred financing costs | 2,235 | 3,177 | ||||||||
Credit loss expense, net | 1,759 | 8,547 | ||||||||
Write-downs, including asset impairments | 1,884 | 7,176 | ||||||||
Deferred income tax benefit | (1,447) | (2,073) | ||||||||
Share-based and other non-cash compensation | 24,230 | 27,573 | ||||||||
Unrealized foreign currency exchange (gain) loss | (212) | 1,108 | ||||||||
Realized and unrealized investment gain | (465) | (70) | ||||||||
Changes in assets and liabilities: | ||||||||||
Accounts receivable | (1,907) | (29,003) | ||||||||
Inventories | (285) | (5,529) | ||||||||
Film assets | (20,394) | (19,598) | ||||||||
Deferred revenue | (3,882) | (11,572) | ||||||||
Changes in other operating assets and liabilities | (35,989) | 801 | ||||||||
Net cash provided by operating activities | 58,615 | 17,321 | ||||||||
Investing Activities | ||||||||||
Purchase of property, plant and equipment | (6,491) | (8,424) | ||||||||
Investment in equipment for joint revenue sharing arrangements | (18,000) | (19,803) | ||||||||
Interest in film classified as a financial instrument | — | (4,731) | ||||||||
Acquisition of other intangible assets | (8,344) | (4,394) | ||||||||
Proceeds from sale of equity securities | 1,045 | — | ||||||||
Acquisition of | — | (15,939) | ||||||||
Net cash used in investing activities | (31,790) | (53,291) | ||||||||
Financing Activities | ||||||||||
Proceeds from revolving credit facility borrowings | 39,717 | 37,871 | ||||||||
Repayments of revolving credit facility borrowings | (53,248) | (3,600) | ||||||||
Proceeds from other borrowings | 322 | — | ||||||||
Repayment of other borrowings | (53) | — | ||||||||
Credit facility amendment fees paid | (46) | (2,279) | ||||||||
Repurchase of common shares, | (26,823) | (80,124) | ||||||||
Repurchase of common shares, IMAX China | (15) | (3,043) | ||||||||
Taxes withheld and paid on employee stock awards vested | (6,466) | (3,687) | ||||||||
Principal payment under finance lease obligations | (480) | (948) | ||||||||
Dividends paid to non-controlling interests | (1,438) | (2,704) | ||||||||
Net cash used in financing activities | (48,530) | (58,514) | ||||||||
Effects of exchange rate changes on cash | 504 | 2,174 | ||||||||
Decrease in cash and cash equivalents during year | (21,201) | (92,310) | ||||||||
Cash and cash equivalents, beginning of year | 97,401 | 189,711 | ||||||||
Cash and cash equivalents, end of year | $ | 76,200 | $ | 97,401 | ||||||
Segment Revenue and Gross Margin | ||||||||||||||||
(In thousands of dollars) | Three Months Ended | Years Ended | ||||||||||||||
2023 | 2022 | 2023 | 2022 | |||||||||||||
Revenue | ||||||||||||||||
Content Solutions | 19,093 | 29,320 | 126,698 | 101,820 | ||||||||||||
Technology Products and Services | 62,490 | 66,107 | 234,303 | 192,368 | ||||||||||||
Sub-total for reportable segments | 81,583 | 95,427 | 361,001 | 294,188 | ||||||||||||
All Other(1) | 4,435 | 2,619 | 13,838 | 6,617 | ||||||||||||
Total | $ | 86,018 | $ | 98,046 | $ | 374,839 | $ | 300,805 | ||||||||
Gross Margin | ||||||||||||||||
Content Solutions | 9,709 | 12,122 | 74,106 | 51,240 | ||||||||||||
Technology Products and Services | 29,880 | 35,179 | 129,946 | 101,055 | ||||||||||||
Sub-total for reportable segments | 39,589 | 47,301 | 204,052 | 152,295 | ||||||||||||
All Other(1) | 4,099 | 1,546 | 10,289 | 4,060 | ||||||||||||
Total | $ | 43,688 | $ | 48,847 | $ | 214,341 | $ | 156,355 | ||||||||
______________ |
(1) All Other includes the results from Streaming and Consumer Technology and other ancillary activities. |
NON-GAAP FINANCIAL MEASURES
(in thousands of
In this release, the Company presents adjusted net income attributable to common shareholders and adjusted net income attributable to common shareholders per basic and diluted share, EBITDA, Adjusted EBITDA per Credit Facility, Adjusted EBITDA margin as supplemental measures of the Company's performance, which are not recognized under
The Company believes that these non-GAAP financial measures are important supplemental measures that allow management and users of the Company's financial statements to view operating trends and analyze controllable operating performance on a comparable basis between periods without the after-tax impact of share-based compensation and certain unusual items included in net income (loss) attributable to common shareholders. Although share-based compensation is an important aspect of the Company's employee and executive compensation packages, it is a non-cash expense and is excluded from certain internal business performance measures.
A reconciliation from net income (loss) attributable to common shareholders and the associated per share amounts to adjusted net income attributable to common shareholders and adjusted net income attributable to common shareholders per diluted share is presented in the table below. Net income (loss) attributable to common shareholders and the associated per share amounts are the most directly comparable GAAP measures because they reflect the earnings relevant to the Company's shareholders, rather than the earnings attributable to non-controlling interests.
In addition to the non-GAAP financial measures discussed above, management also uses "EBITDA," as such term is defined in the Company's Credit Agreement, and which is referred to herein as "Adjusted EBITDA per Credit Facility." As allowed by the Credit Agreement, Adjusted EBITDA per Credit Facility includes adjustments in addition to the exclusion of interest, taxes, depreciation and amortization. Adjusted EBITDA per Credit Facility measure is presented to allow a more comprehensive analysis of the Company's operating performance and to provide additional information with respect to the Company's compliance against its Credit Agreement requirements when applicable. In addition, the Company believes that Adjusted EBITDA per Credit Facility presents relevant and useful information widely used by analysts, investors and other interested parties in the Company's industry to evaluate, assess and benchmark the Company's results.
EBITDA is defined as net income or loss excluding (i) income tax expense or benefit; (ii) interest expense, net of interest income; (iii) depreciation and amortization, including film asset amortization; and (iv) amortization of deferred financing costs. Adjusted EBITDA per Credit Facility is defined as EBITDA excluding: (i) share-based and other non-cash compensation; (ii) realized and unrealized investment gains or losses; (iii) transaction-related expenses; (iv) restructuring and executive transition costs; and (v) write-downs, net of recoveries, including asset impairments and credit loss expense.
A reconciliation of net income (loss) attributable to common shareholders, which is the most directly comparable GAAP measure, to EBITDA and Adjusted EBITDA per Credit Facility is presented in the table below. Net income (loss) attributable to common shareholders is the most directly comparable GAAP measure because it reflects the earnings relevant to the Company's shareholders, rather than the earnings attributable to non-controlling interests.
In this release, the Company also presents free cash flow, which is not recognized under
These non-GAAP measures may not be comparable to similarly titled amounts reported by other companies. Additionally, the non-GAAP financial measures used by the Company should not be considered as a substitute for, or superior to, the comparable GAAP amounts.
Adjusted EBITDA per Credit Facility | ||||||||||||||||||||||||||||||
For the Three Months Ended | For the Three Months Ended | |||||||||||||||||||||||||||||
Attributable to | Less: | Attributable to | Less: | |||||||||||||||||||||||||||
Interests and | Attributable to | Attributable to | Interests and | Attributable to | Attributable to | |||||||||||||||||||||||||
Common | Non-controlling | Common | Common | Non-controlling | Common | |||||||||||||||||||||||||
Shareholders | Interests | Shareholders | Shareholders | Interests | Shareholders | |||||||||||||||||||||||||
(In thousands of | ||||||||||||||||||||||||||||||
Reported net income | $ | 3,311 | $ | 771 | $ | 2,540 | $ | 4,081 | $ | 1,468 | $ | 2,613 | ||||||||||||||||||
Add (subtract): | ||||||||||||||||||||||||||||||
Income tax expense | (1,850) | (147) | (1,703) | 2,016 | 786 | 1,230 | ||||||||||||||||||||||||
Interest expense, net of interest income | 636 | (137) | 773 | 559 | (15) | 574 | ||||||||||||||||||||||||
Depreciation and amortization, including film asset | 13,545 | 1,161 | 12,384 | 13,998 | 1,109 | 12,889 | ||||||||||||||||||||||||
Amortization of deferred financing costs(2) | 493 | — | 493 | 712 | — | 712 | ||||||||||||||||||||||||
EBITDA | $ | 16,135 | $ | 1,648 | $ | 14,487 | $ | 21,366 | $ | 3,348 | $ | 18,018 | ||||||||||||||||||
Stock and other non-cash compensation | 6,400 | 144 | 6,256 | 8,063 | 205 | 7,858 | ||||||||||||||||||||||||
Unrealized investment (gains) losses | (29) | — | (29) | 29 | — | 29 | ||||||||||||||||||||||||
Transaction-related expenses(3) | 327 | 208 | 119 | 166 | — | 166 | ||||||||||||||||||||||||
Write-downs, including asset impairments and | 812 | (37) | 849 | 1,867 | 162 | 1,705 | ||||||||||||||||||||||||
Restructuring and executive transition costs(4) | 1,593 | 258 | 1,335 | — | — | — | ||||||||||||||||||||||||
Adjusted EBITDA per Credit Facility | $ | 25,238 | $ | 2,221 | $ | 23,017 | $ | 31,491 | $ | 3,715 | $ | 27,776 | ||||||||||||||||||
Revenues attributable to common shareholders(5) | 86,018 | 4,687 | 81,331 | 98,046 | 7,273 | 90,773 | ||||||||||||||||||||||||
Adjusted EBITDA margin attributable to common | 29.3 | % | 47.4 | % | 28.3 | % | 32.1 | % | 51.1 | % | 30.6 | % | ||||||||||||||||||
For the Twelve Months Ended | For the Twelve Months Ended | |||||||||||||||||||||||||||||
Attributable to | Less: | Attributable to | Less: | |||||||||||||||||||||||||||
Interests and | Attributable to | Attributable to | Interests and | Attributable to | Attributable to | |||||||||||||||||||||||||
Common | Non-controlling | Common | Common | Non-controlling | Common | |||||||||||||||||||||||||
Shareholders | Interests | Shareholders | Shareholders | Interests | Shareholders | |||||||||||||||||||||||||
(In thousands of | ||||||||||||||||||||||||||||||
Reported net income (loss) | $ | 33,066 | $ | 7,731 | $ | 25,335 | $ | (19,877) | $ | 2,923 | $ | (22,800) | ||||||||||||||||||
Add (subtract): | ||||||||||||||||||||||||||||||
Income tax expense | 13,051 | 1,725 | 11,326 | 10,108 | 1,256 | 8,852 | ||||||||||||||||||||||||
Interest expense, net of interest income | 2,101 | (408) | 2,509 | 1,272 | (251) | 1,523 | ||||||||||||||||||||||||
Depreciation and amortization, including film asset | 60,022 | 5,312 | 54,710 | 56,661 | 4,820 | 51,841 | ||||||||||||||||||||||||
Amortization of deferred financing costs(2) | 2,235 | — | 2,235 | 3,177 | — | 3,177 | ||||||||||||||||||||||||
EBITDA | $ | 110,475 | $ | 14,360 | $ | 96,115 | $ | 51,341 | $ | 8,748 | $ | 42,593 | ||||||||||||||||||
Stock and other non-cash compensation | 24,230 | 774 | 23,456 | 27,573 | 760 | 26,813 | ||||||||||||||||||||||||
Unrealized investment gains | (465) | (93) | (372) | (70) | — | (70) | ||||||||||||||||||||||||
Transaction-related expenses(3) | 3,569 | 208 | 3,361 | 1,122 | — | 1,122 | ||||||||||||||||||||||||
Write-downs, including asset impairments and | 3,273 | 362 | 2,911 | 15,723 | 1,723 | 14,000 | ||||||||||||||||||||||||
Restructuring and executive transition costs(4) | 2,946 | 258 | 2,688 | — | — | — | ||||||||||||||||||||||||
Adjusted EBITDA per Credit Facility | $ | 144,028 | $ | 15,869 | $ | 128,159 | $ | 95,689 | $ | 11,231 | $ | 84,458 | ||||||||||||||||||
Revenues attributable to common shareholders(5) | 374,839 | 25,674 | 349,165 | 300,805 | 20,883 | 279,922 | ||||||||||||||||||||||||
Adjusted EBITDA margin attributable to common | 38.4 | % | 61.8 | % | 36.7 | % | 31.8 | % | 53.8 | % | 30.2 | % | ||||||||||||||||||
______________ | |
(1) | The Senior Secured Net Leverage Ratio is calculated using Adjusted EBITDA per Credit Facility determined on a trailing twelve-month basis. |
(2) | The amortization of deferred financing costs is recorded within Interest Expense in the Condensed Consolidated Statement of Operations. |
(3) | Reflects costs incurred resulting from the Company's proposal to acquire the outstanding 96.3 million shares in IMAX China. |
(4) | Reflects costs in connection with the departure of the President, |
(5) | |
(In thousands of | Three months ended | Three months ended | Year ended | Year ended | |||||||||||||||||||||||||||||||||||
Total revenues | $ | 86,018 | $ | 98,046 | $ | 374,839 | $ | 300,805 | |||||||||||||||||||||||||||||||
$ | 16,521 | $ | 25,728 | $ | 90,496 | $ | 73,330 | ||||||||||||||||||||||||||||||||
Non-controlling interest ownership | 28.37 | % | 28.27 | % | 28.37 | % | 28.48 | % | |||||||||||||||||||||||||||||||
Deduction for non-controlling interest | (4,687) | (7,273) | (25,674) | (20,883) | |||||||||||||||||||||||||||||||||||
Revenues attributable to common | $ | 81,331 | $ | 90,773 | $ | 349,165 | $ | 279,922 | |||||||||||||||||||||||||||||||
(6) | Weighted average ownership percentage for change in non-controlling interest share |
Adjusted Net Income Attributable to Common Shareholders and Adjusted Net Income Per Share | ||||||||||||||||
Three Months Ended | Three Months Ended | |||||||||||||||
(In thousands of | Net Income | Per Diluted | Net Income | Per Diluted | ||||||||||||
Net income attributable to common shareholders | $ | 2,540 | $ | 0.05 | $ | 2,613 | $ | 0.05 | ||||||||
Adjustments(1): | ||||||||||||||||
Share-based compensation | 6,074 | 0.11 | 7,730 | 0.14 | ||||||||||||
Unrealized investment gains | (32) | — | 29 | — | ||||||||||||
Transaction-related expenses(2) | 119 | — | 166 | — | ||||||||||||
Restructuring and executive transition costs(3) | 1,335 | 0.02 | — | — | ||||||||||||
Tax impact on items listed above | (747) | (0.01) | 17 | — | ||||||||||||
Adjusted net income(1) | $ | 9,289 | $ | 0.17 | $ | 10,555 | $ | 0.19 | ||||||||
Weighted average basic shares outstanding | 53,973 | 54,816 | ||||||||||||||
Weighted average diluted shares outstanding | 54,983 | 55,659 | ||||||||||||||
Year Ended | Year Ended | |||||||||||||||
(In thousands of | Net Income | Per Diluted | Net (Loss) | Per Diluted | ||||||||||||
Net income (loss) attributable to common shareholders | $ | 25,335 | $ | 0.46 | $ | (22,800) | $ | (0.40) | ||||||||
Adjustments(1): | ||||||||||||||||
Share-based compensation | 23,184 | 0.42 | 26,382 | 0.46 | ||||||||||||
COVID-19 government relief benefits, net | — | — | (373) | (0.01) | ||||||||||||
Unrealized investment gains | (558) | (0.01) | (70) | — | ||||||||||||
Transaction-related expenses(2) | 3,361 | 0.06 | 1,122 | 0.02 | ||||||||||||
Restructuring and executive transition costs(3) | 2,688 | 0.05 | — | — | ||||||||||||
Tax impact on items listed above | (1,931) | (0.04) | (1,054) | (0.02) | ||||||||||||
Adjusted net income(1) | $ | 52,079 | $ | 0.94 | $ | 3,207 | $ | 0.06 | ||||||||
Weighted average shares outstanding - basic | 54,310 | 56,674 | ||||||||||||||
Weighted average shares outstanding - diluted | 55,146 | 57,371 | ||||||||||||||
_______________ | |
(1) | Reflects amounts attributable to common shareholders. |
(2) | Reflects costs in connection with the Company's proposal to acquire the outstanding 96.3 million shares in IMAX China in 2023 and costs incurred associated with the acquisition of SSIMWAVE in 2022. |
(3) | Reflects costs in connection with the departure of the President, |
Free Cash Flow | ||||||||||
Year Ended | Year Ended | |||||||||
(In thousands of | ||||||||||
Net cash provided by operating activities | $ | 58,615 | $ | 17,321 | ||||||
Purchase of property, plant and equipment | (6,491) | (8,424) | ||||||||
Acquisition of other intangible assets | (8,344) | (4,394) | ||||||||
Free cash flow before growth CAPEX | 43,780 | 4,503 | ||||||||
Investment in equipment for joint revenue sharing arrangements | (18,000) | (19,803) | ||||||||
Free cash flow | $ | 25,780 | $ | (15,300) | ||||||

 View original content to download multimedia:https://www.prnewswire.com/news-releases/imax-corporation-reports-q4-and-full-year-2023-results-302073255.html
SOURCE